
http://synapse.princeton.edu/~sam/ev_prediction_1nov.jpg
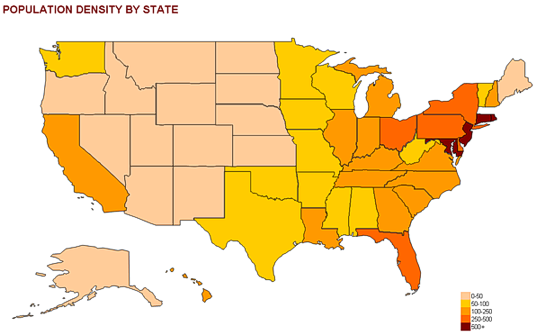
Statistical Maps show quantities along with areas where those quantities come from. For instances, the map above shows who one the electoral votes within the states along with the distortion of the states representing the amount of votes.


