 http://chesters.org/marvin/GINI/Gini.jpg
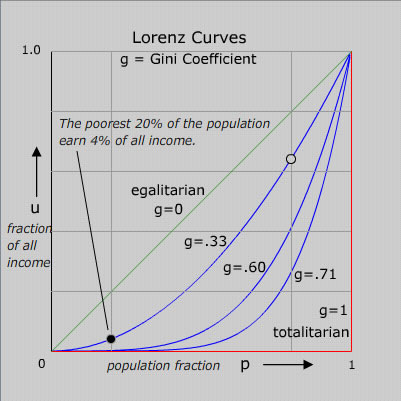
A Lorenz Curve is a representation of probability or percentage data. The creator, Max Lorenz, used the Lorenz Curve to explain income distribution. In the above map, there is a different blue curve for each change in coefficient.
No comments:
Post a Comment